How to Implement—and Value—Video Advertising Revenue Diagnosis
The final article in this series puts the Video Advertising Revenue Diagnosis Framework to work—and shows how to test whether it creates measurable value.
A video business opens its weekly report and finds net advertising revenue 18% below its £1.2 million baseline. The movement is worth £216,000.
Yet the signals around it appear reassuring. Viewing has increased. A headline CPM measure has increased. The ad server reports broadly stable fill.
Each statement may be accurate. None explains the combined result. Meanwhile, the adverse movement represents approximately £30,900 for every day the condition persists.
The previous article introduced the Video Advertising Revenue Diagnosis Framework: a way to connect a material revenue movement with its contributing commercial, advertising and technology evidence. This final article asks what happens when that framework meets a real operating environment.
The first lesson is also the central proposition:
Do not begin with where AI can be added. Begin with where net revenue stops reconciling.
All figures and outcomes in the two cases that follow are illustrative. Their purpose is to show how value can be tested, not to present customer results.
Follow the money backwards
Implementation starts with the report the business already uses to answer a basic management question: how did our video advertising business perform?
The revenue number is then traced backwards through the chain that produced it:
Net revenue → fees and revenue shares → gross revenue → demand and price → delivered ads → eligible opportunities → sessions and audience
At each point, the business establishes the definition, source, timing and owner of the number. It cannot assume that the same term means the same thing in every system. “Fill rate”, for example, may describe demand responses, ad-server decisions, inserted ads or measured impressions, depending on the denominator.
It also helps to separate three revenue states:
Expected revenue: what the business anticipates under agreed audience, inventory and commercial conditions.
Provisional earned revenue: the operational estimate derived from delivery, price and partner reporting.
Settled revenue: the later figure confirmed through reconciliation, invoicing and Finance.
In the illustrative case, the £216,000 movement is not one problem. It combines less-monetisable audience mix, demand and price effects, and a smaller reporting-timing difference that is not an economic loss.
The largest actionable component appears after the ad-server hand-off. Within the same device, content, region and time cohort, ad responses remain present while rendered and measured impressions diverge. The evidence does not prove causality by itself, but it focuses the next test on a specific delivery boundary rather than on the whole value chain.
A simple executive version is to ask: if 100 streams begin and 80 produce monetised outcomes, can the business explain the other 20? Some will be expected; others may reveal avoidable loss.
The objective is not to impose an ideal architecture. It is to find the earliest material point at which the actual revenue lineage stops reconciling.
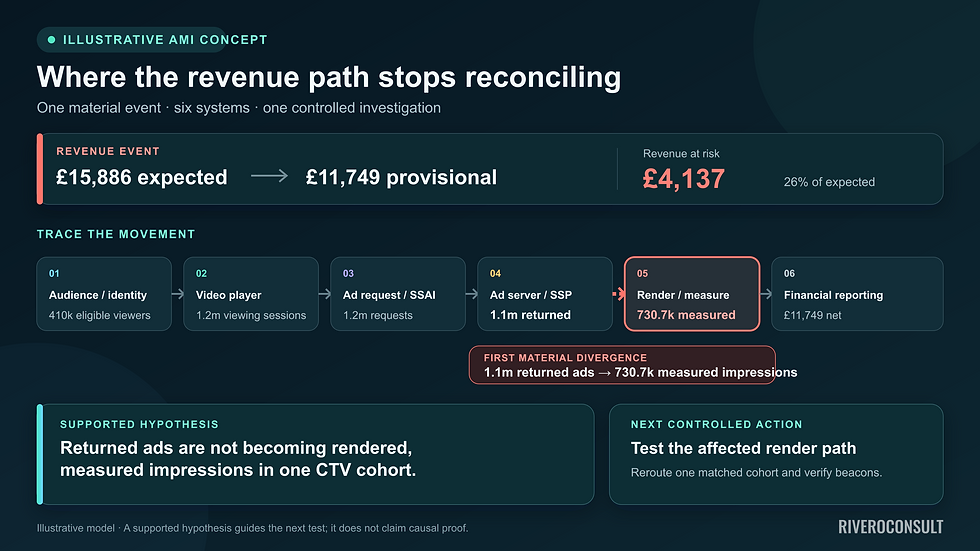
Illustrative AMI concept: tracing a revenue movement across existing systems identifies the first material divergence and connects it to commercial exposure.
Investigate material cases—not everything
Video advertising produces too many events, alerts and variations for every signal to become an AI investigation.
The practical unit of work should be a material monetisation event: a condition with enough commercial significance to warrant attention. Several alerts may belong to one event; another may have no material effect.
This creates a useful division of labour. Conventional data processing measures and reconciles the relevant population. Deterministic rules calculate discrepancies, identify affected cohorts and estimate commercial exposure. AI can then assist with a bounded case: comparing compact evidence, testing plausible explanations, identifying the next useful question and translating the findings for a decision-maker.
The troubleshooting discipline remains familiar: test hypotheses against confirming and disconfirming evidence, and record what has been ruled out. AI can accelerate that work; it should not replace reproducible calculations or accountable judgement.
The economic distinction is equally important:
Streams drive data-processing volume. Material investigations drive AI workload.
Before opening a case, the business must still establish whether the required evidence exists, can be joined and is accessible at a cost proportionate to the value at stake. Partner data may arrive at different levels of detail, use incompatible identifiers or involve additional retrieval and processing costs.
The right decision may be to narrow the question, improve instrumentation—or stop because the evidence or economics cannot support the intended outcome. Readiness is part of the commercial diagnosis.
This is why more agents are not, by themselves, the answer. As Clinch CEO Oz Etzioni argued in Digiday, intelligence across disconnected data and workflows can create activity without alignment. Revenue diagnosis need not require one physical platform, but it does require a governed commercial model, consistent definitions and a case through which permitted evidence remains connected.
A recommendation is not a result
A plausible explanation may improve a meeting. It does not yet create commercial value.
The operating loop has to continue:
See → Explain → Decide → Act → Verify → Learn
The diagnostic case should keep three states visibly separate: what was recommended, what was actually executed and what happened afterwards.
Revenue may recover after a recommendation because demand changed, audience mix shifted or somebody took a different action. Without confirmed execution and a credible comparison, the result should not be claimed.
In the scenario, the existing process takes eight business days to authorise a first intervention. A configured case reduces that to two by identifying the affected cohort, focusing the partner request and supporting a reversible action.
The value calculation remains conservative:
Avoided exposure = daily adverse variance × days of earlier action × actionable share × mitigation effectiveness
If action occurs six days earlier, 45% of the movement is judged actionable and the intervention mitigates 60% of that share, the modelled avoided exposure is approximately £50,000.
This does not claim that £216,000 was recovered. It values earlier action against the portion the business could reasonably influence. Investigation hours saved should be measured separately.

Illustrative planning model: value is calculated against the actionable share of the movement and the effectiveness of the intervention—not the complete revenue gap.
The broader principle is simple:
Revenue intelligence is not the ability to generate an explanation. It is the ability to show how a movement became a decision, what changed and what it was worth.
The same method can find growth
Revenue diagnosis is not only a defensive capability for large publishers.
Imagine a specialist video publisher with a lean commercial and operations team. Ad-supported viewing has grown by 20%, but monthly net advertising revenue has increased by only 4%, from £250,000 to £260,000. At the previous net yield per unit of viewing, revenue would have reached £300,000.
The resulting £40,000 conversion gap is a question, not a forecast of recoverable revenue.
A lightweight implementation uses reports already supplied by the video platform, ad server, supply partners and Finance. It finds that much of the new viewing occurred in lower-monetising environments. It also identifies two bounded opportunities: inconsistent metadata and consent signals in one valuable device workflow, and limited demand access for a high-engagement inventory cohort.
Instead of attempting to optimise the whole chain, the publisher runs two controlled tests. Under illustrative assumptions, the eligibility change produces £7,200 in additional monthly net revenue and the demand test produces £3,200—a combined £10,400 during a comparable measurement period.
The result would still require a matched cohort, phased rollout or adjusted baseline to separate the intervention from seasonality, audience change and market pricing. But a smaller publisher does not need to build a universal data platform before it can ask a bounded question and test two affordable responses.
For an operational expert, the value lies in replacing broad troubleshooting with precise evidence requests and controlled tests. For a decision-maker, it lies in directing limited resources towards the opportunities most likely to change net revenue.
How to test whether the capability is worth building
The first implementation does not need to be a platform procurement or transformation programme. It can begin with one material or recurring revenue question:
Trace: map the number through the actual systems, definitions and owners.
Qualify: determine whether the evidence and economics can support an answer.
Back-test: apply the method to a known historical case using evidence available at the time.
Shadow: compare live cases with the existing process, including speed, effort, decision quality and operating cost.
Activate: permit controlled action only when confidence, ownership and safeguards are sufficient.
The immediate outputs are tangible: a revenue-lineage map, an evidence-readiness assessment, a value hypothesis and a supported decision on whether a live pilot is justified. A negative conclusion can still be valuable if it prevents investment in a capability the available evidence cannot sustain.
For a media business, this process tests whether one unresolved movement can become a faster, more accountable decision. For a technology provider, it can show where existing operational intelligence could be connected to customer-level commercial outcomes—without claiming ownership of the entire value chain.
This can help a platform quantify revenue-impacting conditions, prioritise customer interventions and demonstrate the commercial contribution of capabilities that are otherwise described mainly through operational metrics.
From framework to commercial starting point
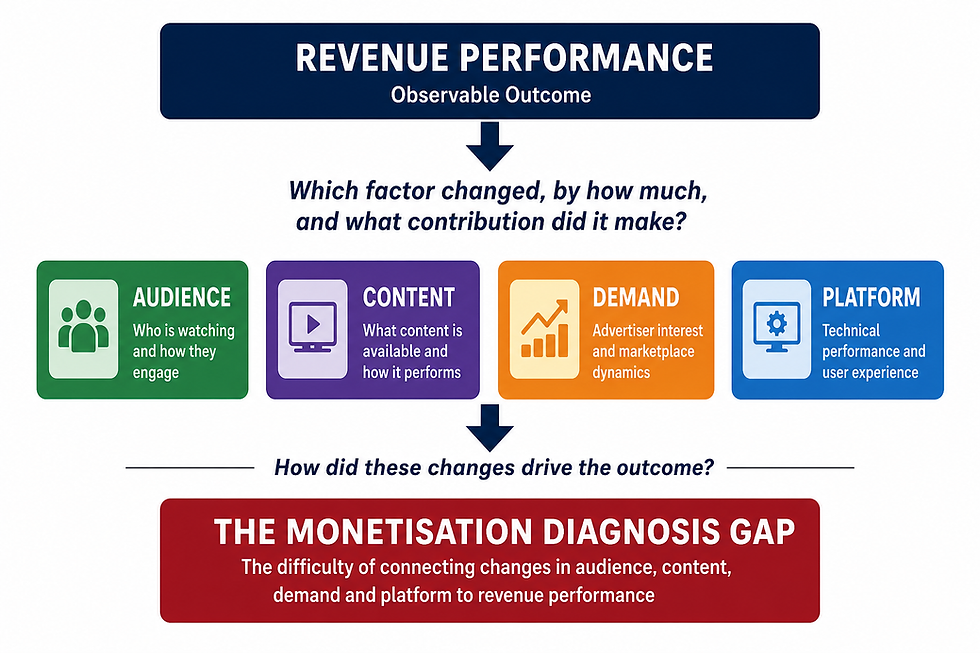
This series began with the monetisation diagnosis gap: the distance between seeing that revenue changed and understanding why. It challenged the idea that more dashboards necessarily close that gap, examined the cost of slow diagnosis, and defined a framework organised around the business outcome.
Implementation supplies the final discipline. Begin with the revenue number. Investigate material cases rather than everything. Measure what happened after the recommendation.
The Video Advertising Revenue Diagnosis Framework defines the method. AI Monetisation Intelligence is Riveroconsult's initiative for turning it into a capability that connects commercial, advertising and technology signals, improves monetisation decisions and builds learning across cases.
Three questions indicate whether there is work to do:
Can we trace a material net-revenue movement across the systems and partners that produced it?
Can we identify the next justified action while value may still be recoverable or created?
Can we demonstrate whether that action changed the commercial result?
If your business has one material revenue movement it cannot trace, one area where audience growth is not becoming revenue—or one customer outcome your technology helps create but cannot yet demonstrate—that is enough to begin.